
Common Data Transformation Techniques for Data Engineers
Why transform data? What are the techniques in data transformation? This article aims to answer these questions.

Why transform data?
Data transformation is the “T” in your ETL (Extract, Transform and Load) process that prepares data for analysis, self-service reports, Business Intelligence dashboards, etc.
Typically the data stored in the source systems are not structured in a way that is suitable for analysis. You will need to clean, organize and enrich the data to make it ready for analysis. This allows business users to understand their customers better, identify new opportunities and most importantly make better decisions.
Without data transformation, analysts would be writing ad hoc queries against raw data sources, data engineers will be bogged down in maintaining deeply technical pipelines, and business users will not be able to make data-informed decisions in a scalable way — dbt Labs
Few examples or situations where data transformation are used
Your transactional data might be stored in a NoSQL database like MongoDB, in such cases you have to convert the JSON object into relational database with rows and columns and only then you will be able to analyze the data.
When you want to filter only a handful of events or move some of the data into your data warehouse. For example, you may want to analyze data of only the customer who are born after 1990.
Anonymize sensitive information before loading it into data warehouse. For example, details like customers’ phone number and email address might have to be masked before making the data accessible to your business users.
Map data from different sources to a common definition. For example, assume that you have two sales information from different store locations. The first store stores the sales amount in US dollar and the other is in Euro. Transformation can help you deal with this inconsistency by standardizing the sales amount (currency) into US dollar.
Data transformation techniques
There are various techniques to do data transformation and the more complex your data is, the more techniques you would need to apply on the data. Here are the most common data transformation techniques used by data and analytics engineers:
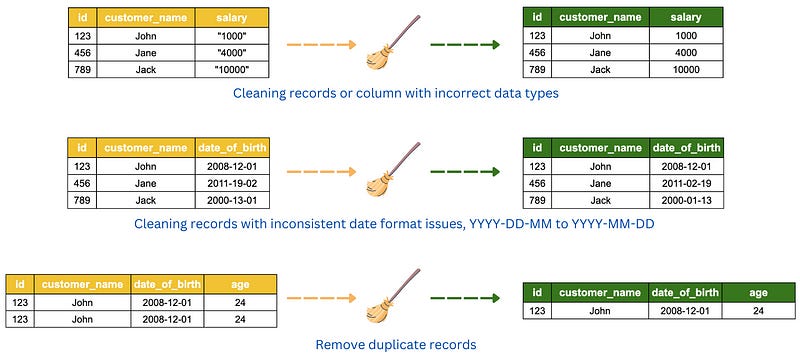
1. Data cleansing.
Most of the data (raw) from source systems are dirty, incomplete and inconsistent. They may have unexpected format (such as JSON object), incorrect data types, missing values, duplicate records, repeated columns, inappropriate column names, etc. Data cleansing is the set of activities that you take to detect the inaccurate parts of the data and correcting all the issues found to arrive at a much cleaner datasets.
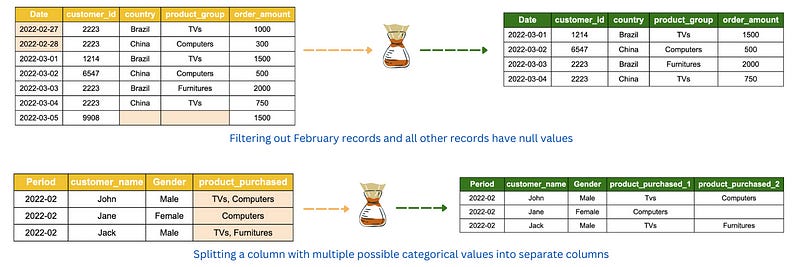
2. Data splitting.
The objective of data splitting is to separate data into groups and structured format that is relevant to analyst or business user’s requirements. This may involve filtering out irrelevant columns and rows and also splitting information in a column that contains multiple categorical values.
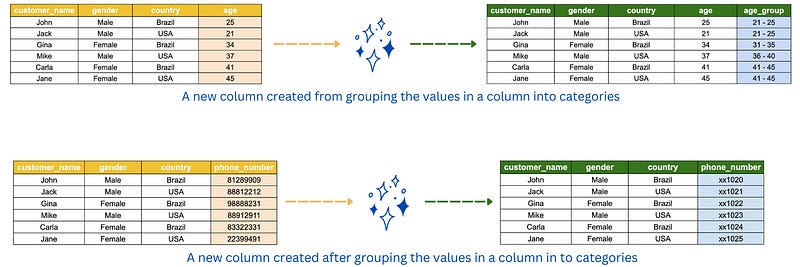
3. Data manipulation.
Data manipulation is the process of modifying the existing data to make it more organized and readable for analysts and business users. Some examples of data manipulation are sorting the data in alphabetically for easy comprehension, masking confidential information such as bank account number and grouping data into bins, interval or categories for easier analysis.
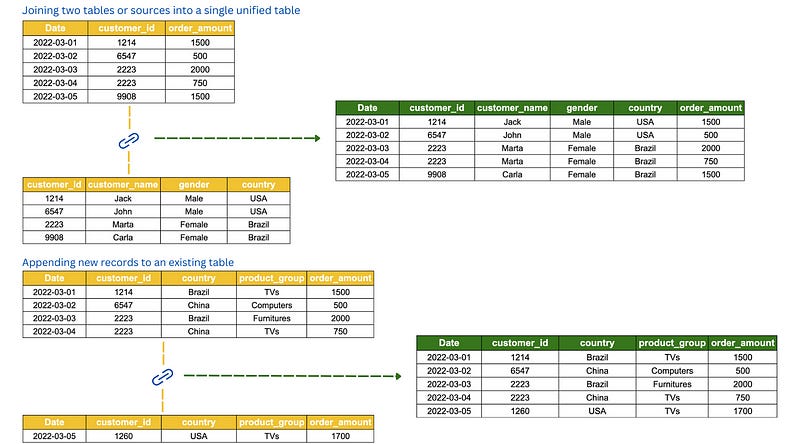
4. Data integration.
A common task in data transformation is to combine data from multiple sources, to create a unified view of the data. Data integration may involve joining different data or tables into a single unified table and appending records or rows into a table.
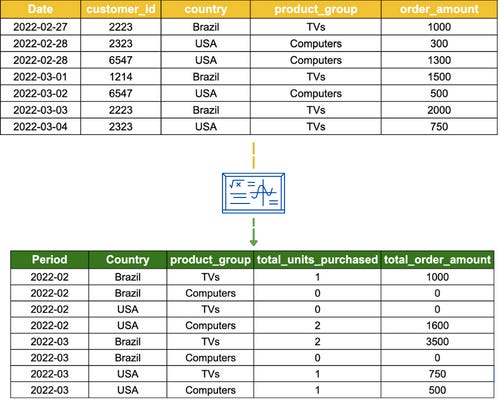
5. Data aggregation.
Data aggregation is used when there is a need for data to be summarized for statistical analysis and reporting. This technique summarizes the measures (metrics) of your data against the dimensions (categorical information) in your data using aggregation functions such as SUM, COUNT and AVERAGE (in SQL). This allows business users to compare a wide range of data points, such as how sales differs across gender and country.
6. Other techniques:
Data derivation. This technique creates a new data value from one or more contribution data values. As an example, a customer’s average spending is derived from his/her total spend divided by total transactions.
Data normalization. This technique is used on continuous data to scale the values into a smaller range so that they can be compared with each other. There are 2 popular methods to normalize your continuous data; Z-score normalization and Min-Max normalization.
I hope this post serves its purpose well and able to provide you with valuable information for your journey in data engineering and data transformation. If you have any feedback please let me know in the comment section.